Good afternoon everybody!
I’m trying to replicate the results shown in the “founding paper” (D. Lucsányi, R. G. Alía, K. Biłko, M. Cecchetto, S. Fiore and E. Pirovano, “G4SEE: A Geant4-Based Single Event Effect Simulation Toolkit and Its Validation Through Monoenergetic Neutron Measurements,” in IEEE Transactions on Nuclear Science, vol. 69, no. 3, pp. 273-281, March 2022, doi: 10.1109/TNS.2022.3149989).
By modifying the macro input files of the second tutorial, I’ve created a 300um thick and 20mm wide silicon sensitive volume, which I irradiate with 8MeV (or 18MeV) neutrons. I’m aware that by no including the Al lid I’m under-representing the number of incident protons, however I felt this would be acceptable for a first rough test to see if I got similar distributions.
After running the simulation with 10e6 particles with detailed scoring enabled, I created a small Python script that plotted the energy deposited by different particle species. The result for 18MeV is shown next.
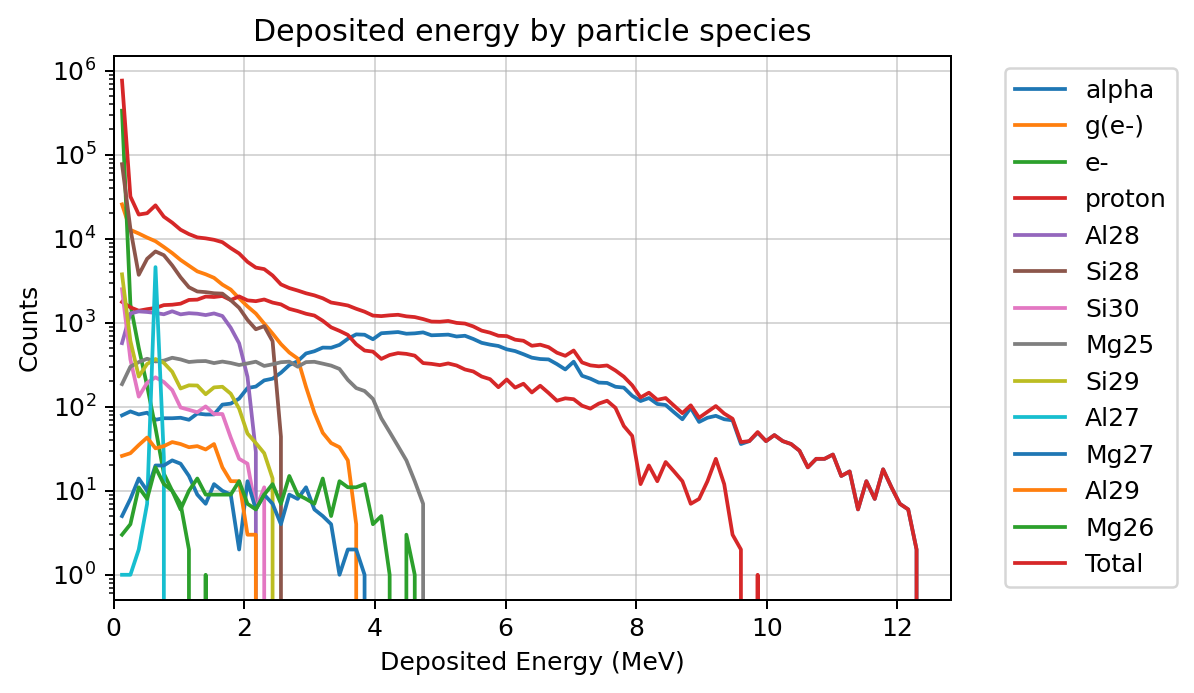
Please excuse the presentation and lack of normalization as I have not polished the graph just yet.
However, the detailed scoring in the paper is not classified according to particle type but to the reaction type instead. To make sure I’m obtaining comparable (and thus meaningful) results I would like to show my data in the same way.
How can I do this? Are the products of specific reactions grouped in someway in the output file or is it calculated in post-processing? At first I thought all particles with the same “event” number corresponded to the same reaction but I wanted to make sure it is this way (or not) before moving forward.
Thank you very much for any help!
Cai